-20%


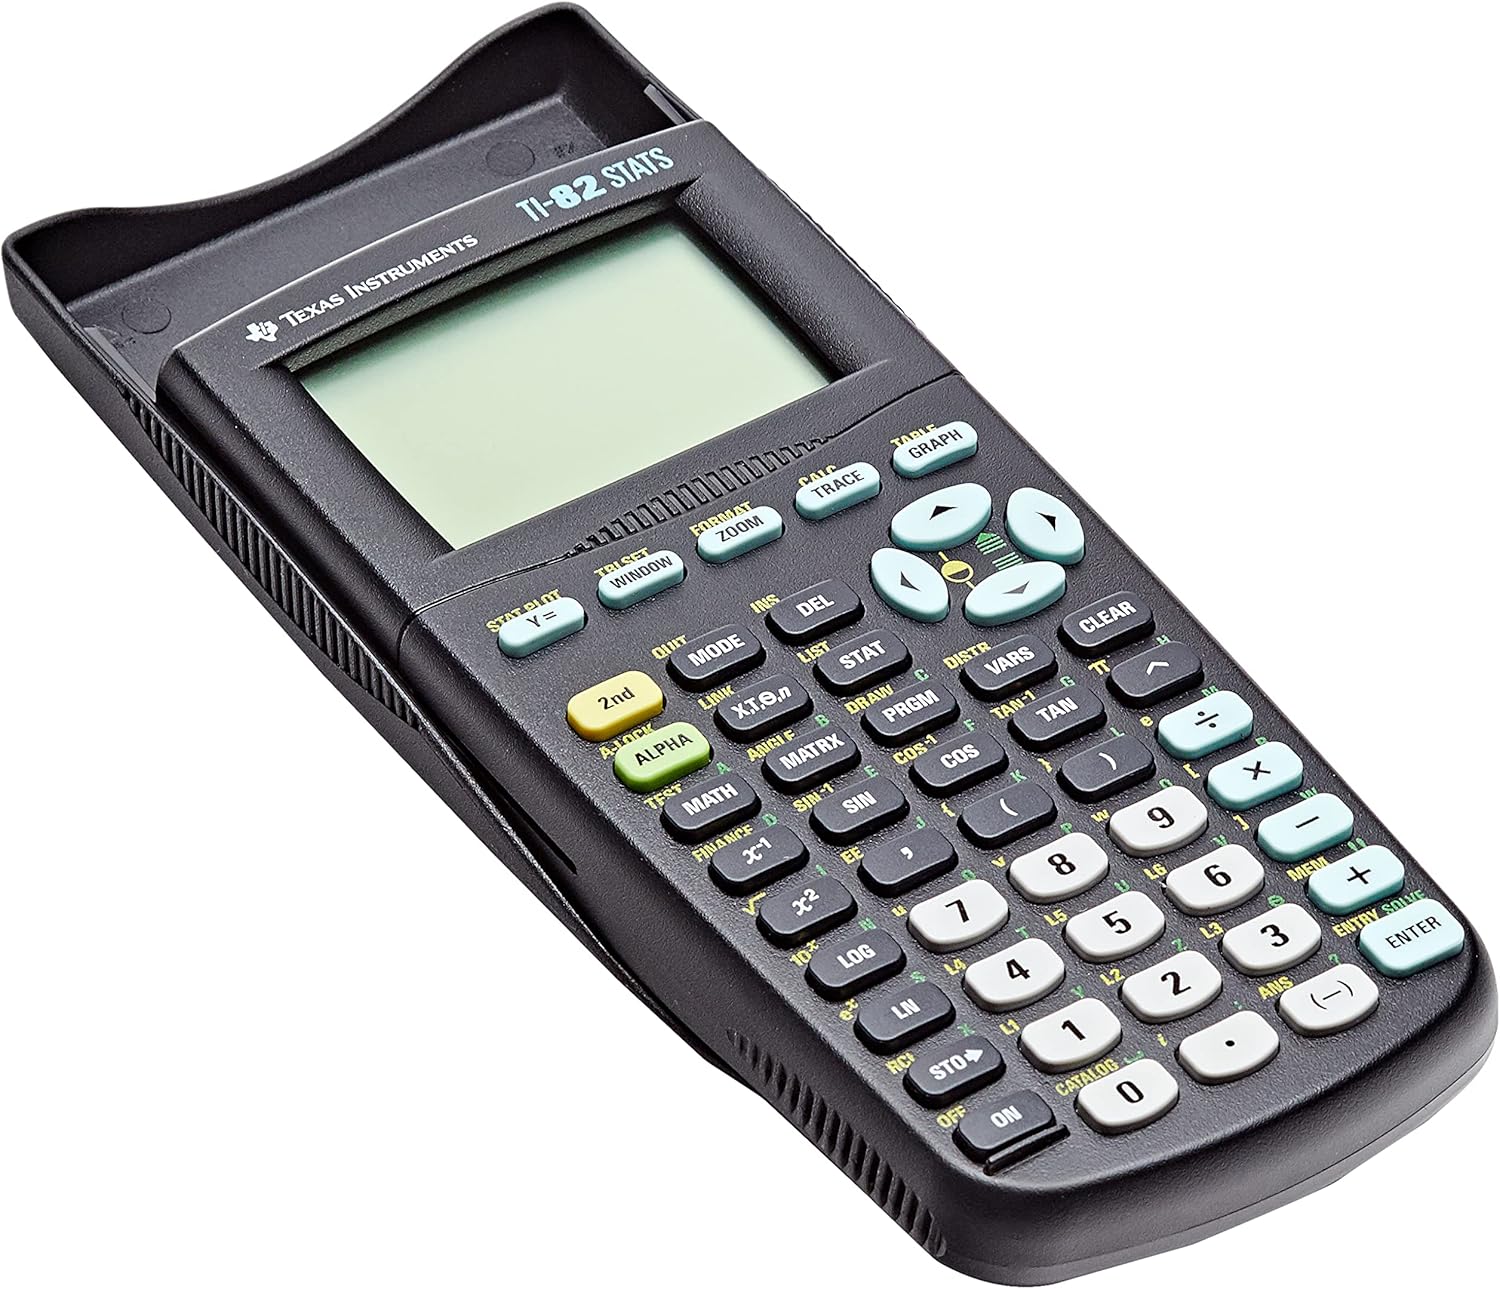


Texas Inst. TI-82 Stats

$307.79
- Graphical analysis – find function values, roots, intersections, maximums, minimums, derivatives, and integrals. Analyse a graph interactively while you view it.
- Plots – four plot types including scatter, box-and-whisker, xy-lines, and histograms. Define and store up to 3 plots from the Stat Plot editor.
- Data analysis – choose from eight regression models and four plot types. Available regressions include median-median line and quadratic, cubic, and quartic polynomial regressions.
- Graph-table split screen – allows you to trace the graph and scroll table values simultaneously.
- Matrices – analyse up to 5 matrix variables. Size limited only by available memory.
Out of stock
buy on amazon
Reviews
There are no reviews yet.